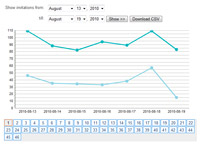
 The graphical representation of your SL group effectiveness is now available!
The graph displays two values: the number of sent invitations and number of accepted invitations (see example picture at the right).
The graph allows to evaluate the average amount of accepted invitations, and acceptance rate. The usual acceptance rate is 15-30% (e.g. 15 of 100 visitors join your group). The graph also allows to evaluate your Second Life group description effectiveness.